The following table shows the COVID-19 infected persons on 2021-08-06 in the Städteregion Aachen, I also listed the Inzidenz for each region:
| Kommune | Aktiv | Positiv | Tote | Inzidenz |
|---|---|---|---|---|
| Städteregion | 305 | 27180 | 591 | 30.5192 |
| Aachen | 158 | 11676 | 236 | 31.732 |
| Alsdorf | 34 | 2552 | 44 | 46.6606 |
| Baesweiler | 16 | 1538 | 23 | 44.2919 |
| Eschweiler | 22 | 2781 | 57 | 19.4752 |
| Herzogenrath | 8 | 2157 | 60 | 6.469 |
| Monschau | 5 | 419 | 13 | 25.6564 |
| Roetgen | 3 | 352 | 25 | 11.5634 |
| Simmerath | 12 | 610 | 19 | 38.9509 |
| Stolberg | 27 | 3080 | 50 | 37.1905 |
| Würselen | 19 | 2014 | 64 | 30.9629 |
Data source: Open.NRW CKAN
The following line plots show the COVID-19 infected persons (2020-09-16 - 2021-08-06) in the Städteregion Aachen. As you can see in all plots that it’s increasing to the 🌊 4th-wave (4. Welle).
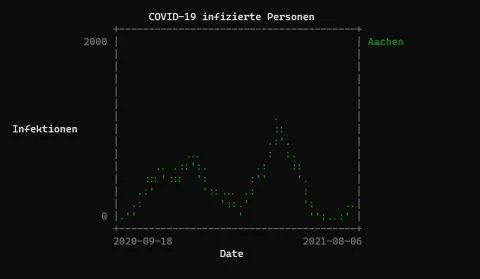
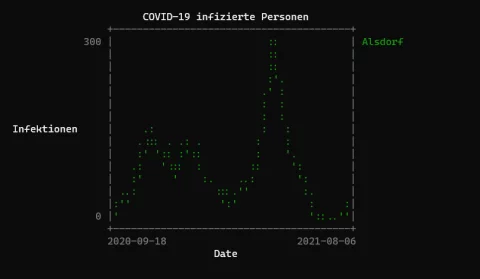
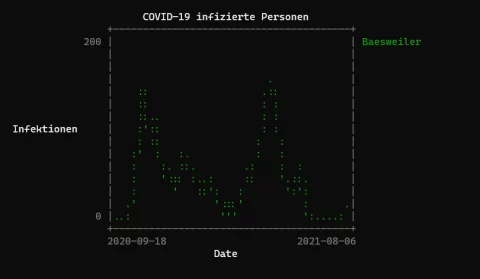
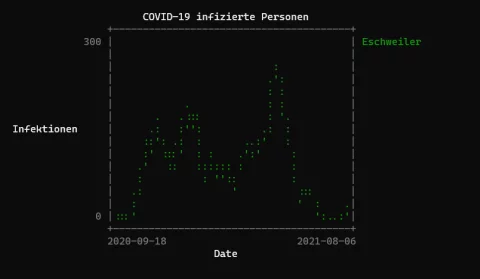
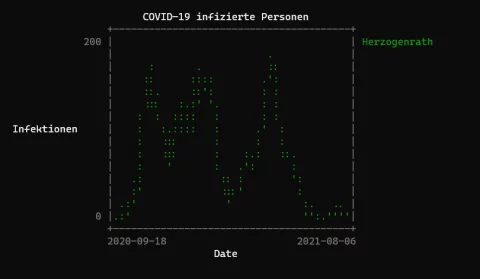
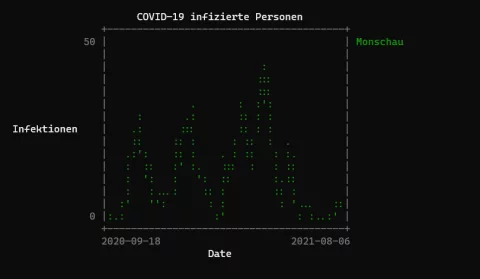
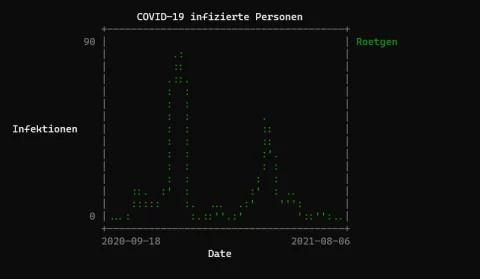
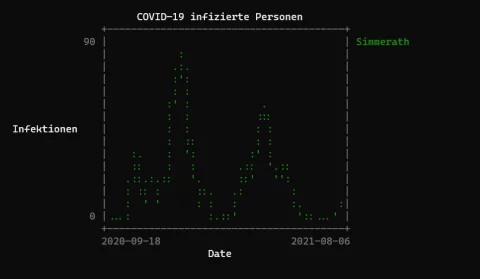
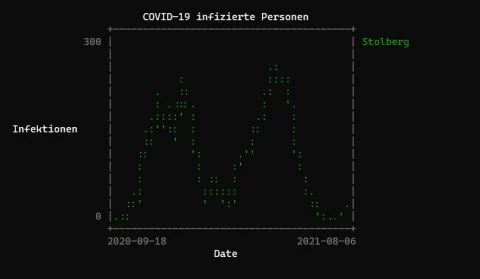
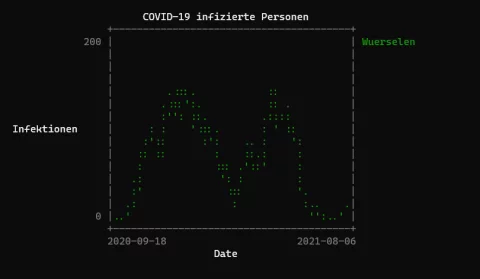
Data source: StädteRegion Aachen
The following plots show the first differences of the time series:
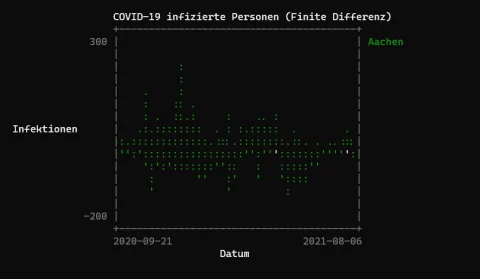
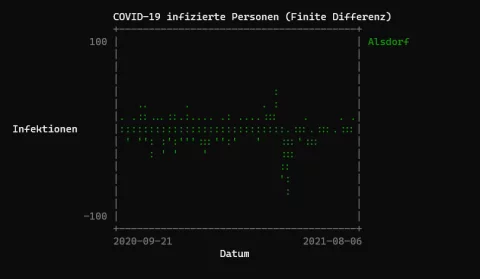
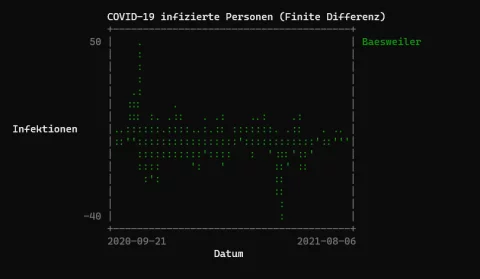
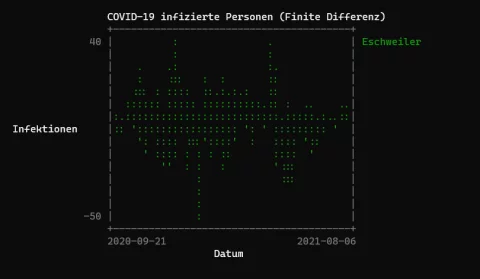
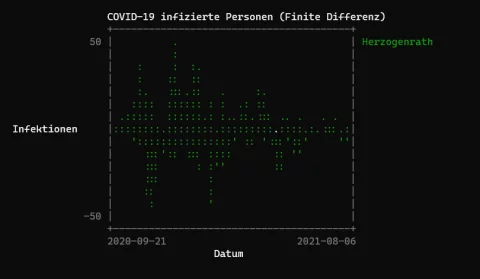
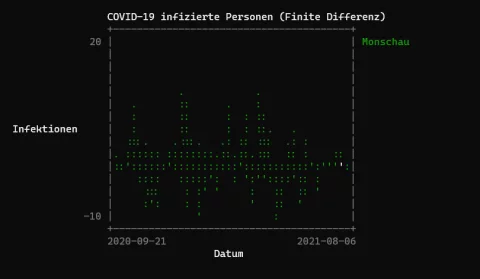
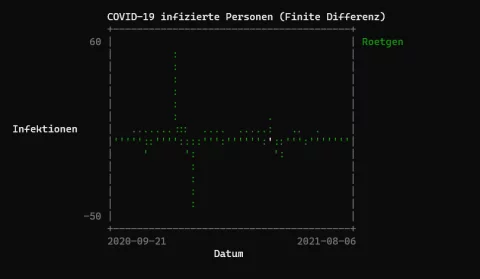
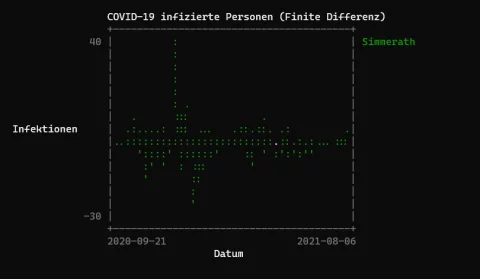
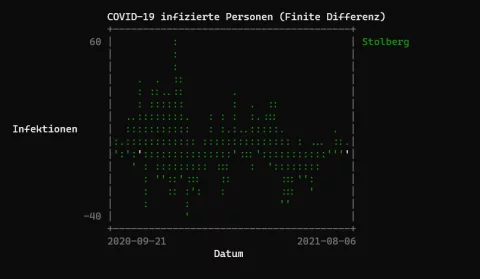
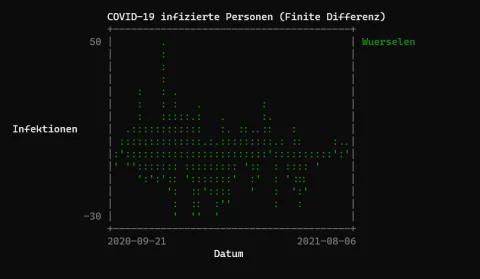
Data source: StädteRegion Aachen
Links:
-
heise online - Wie Corona-Cluster bei Geimpften den Traum von der Normalität zerstören
-
MDR - Warum jetzt ein guter Zeitpunkt ist, sich auf die vierte Welle einzustellen
#COVID19 #COVID19de #Delta #MaskUp #4thWave #Aachen #Alsdorf #Baesweiler #Eschweiler #Herzogenrath #Monschau #Roetgen #Simmerath #Stolberg #Wuerselen